Welcome to the 58th Edition of the Lenders Digest.
The newsletter is designed to report on recent data of interest and none of the following should be taken as financial advice. You should seek professional advice before making any investment decisions.
This week, I want to share a chart from AMP’s Shane Oliver which he shared on Twitter/X, where he argues that inflation is coming down overall.
The concerns I have personally are around electricity costs, oil prices and rental/housing prices rising (as a result of the immigration policies in place) and personally feel that until we slow the pace of migration, progress on reducing the CPI number will be slow.
Macrobusiness reports that nonfarm payrolls came in much lower than expected overnight, you can also see a clear trend of the employment market weakening.
The NFP killed the no-landing fantasy, coming well below consensus:
Total nonfarm payroll employment increased by 175,000 in April, and the unemployment rate changed little at 3.9 percent, the U.S. Bureau of Labor Statistics reported today. Job gains occurred in health care, in social assistance, and in transportation and warehousing.
…The change in total nonfarm payroll employment for February was revised down by 34,000, from +270,000 to +236,000, and the change for March was revised up by 12,000, from +303,000 to +315,000. With these revisions, employment in February and March combined is 22,000 lower than previously reported.
Retail sales growht is also weak (chart thanks to IFM/Macrobusiness)
I have some charts below from
I have also included some interesting charts which show the global liquidity cycles movements and may be a catalyst for asset price apprecation.
Australian Property Market
Perth remains the clear leader of the cycle, Melbourne remains flat, and the rest of the market seems to be continuing at the same pace that it has now for some time.
Asking prices are contained below, the market remains relatively healthy according the these figures.
Inflation Overseas
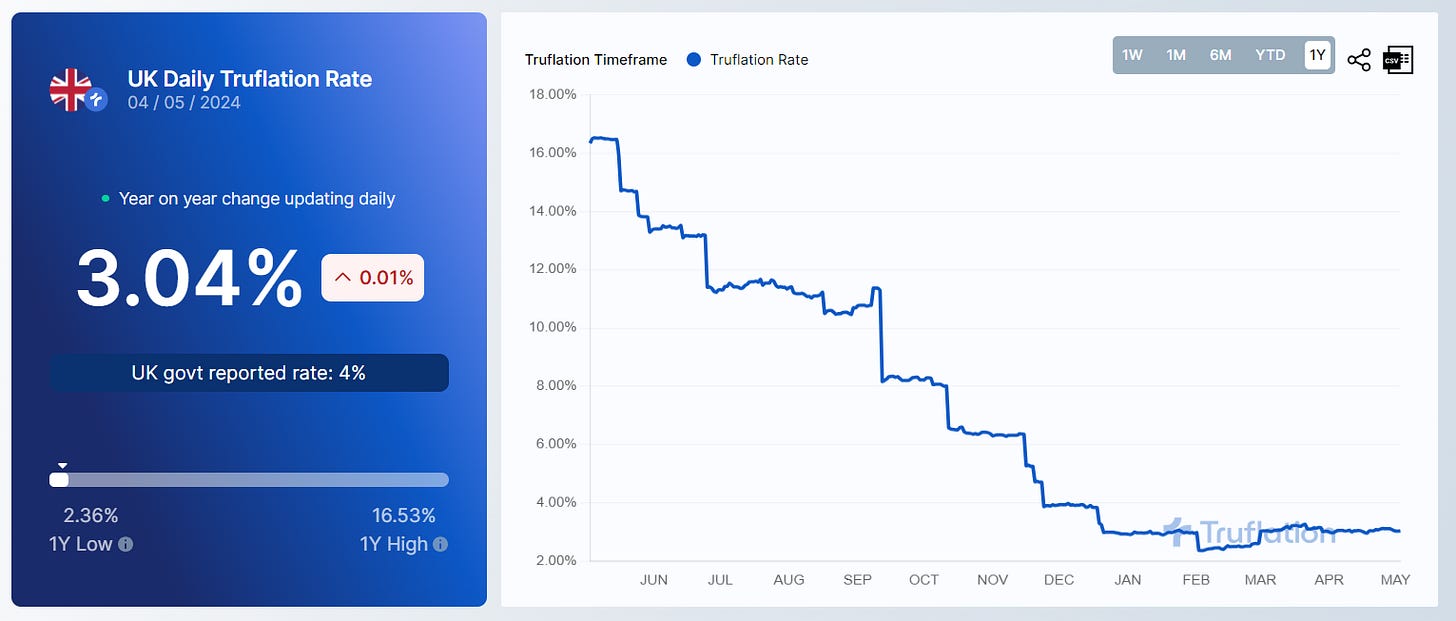
US inflation according to Truflations model continues to trend back down toward the lower part of the 2% range, and UK inflation remains flat around 3%. That doesn’t seem to be celerebated as much as perhaps it should be considering it was running at 15% on their model just recently
Oil and Bonds
WTI Crude declined in price this week, going from $83.66 to $77.99.
US 2-year Treasury yields decreased this week, from 4.993% to 4.806%, while US 10-year Treasury yields decreased from 4.663% to 4.497%. US 30-year Treasury yields also decreased from 4.776% to 4.66%.
This week, the Australian 2-year bond decreased, from 4.19 to 4.108%, which has a high level of correlation with future cash rate expectations and indicates we are not likely to see rate cuts soon.
ASX Rate Tracker Index
Below we can see that the market has cash rate expectations flat currently, not pricing any hikes or cuts in the near term.


